 By sercan386 on Dec 18, 2008
Introduction
Hello world!
This is my newest script, ChartGenerator.
Basically, it creates a chart out of the inserted formula.
**Features:*** 3 diffrent formulas to insert, with diffrent colors.
PICTURE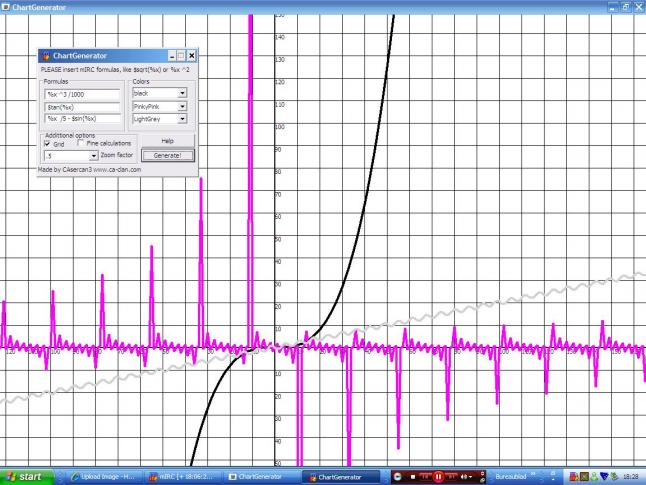
;BOF
;ChartGenerator 1.8
;Made by CAsercan3 on March the 30th, 2009.
;To install, paste this script into your remotes (alt + r)
;Then type /bb, or right click the channel and click "ChartGenerator"
;If you need any help, press the Help button.
alias bb {
  window -paxdk0 @ChartGenerator
  dialog -md chartdialog chartdialog
  set %xmouse 300
  set %ymouse 300
}
menu @ChartGenerator {
  sclick: {
    set %xmouse $mouse.x
    set %ymouse $mouse.y
    chart_eval
    bbb
  }
}
alias -l chart_eval {
  set %zoomfactor $calc($did(chartdialog,2) * 8)
  if ( %zoomfactor == 0 ) set %zoomfactor 8
  set %formula1 $did(chartdialog,3)
  set %formula2 $did(chartdialog,5)
  set %formula3 $did(chartdialog,6)
  set %grid $did(chartdialog,9).state
  set %legend $did(chartdialog,18).state
  set %fine $did(chartdialog,30)

  set %sq 10
  while %sq != 27 {
    inc %sq
    IF ( %SQ == 14 ) set %sq 26
    if ($did(chartdialog,%sq) == White ) set %color $+ [ %sq ] 0
    if ($did(chartdialog,%sq) == black ) set %color $+ [ %sq ] 1
    if ($did(chartdialog,%sq) == DarkBlue ) set %color $+ [ %sq ] 2
    if ($did(chartdialog,%sq) == Green ) set %color $+ [ %sq ] 3
    if ($did(chartdialog,%sq) == FireRed ) set %color $+ [ %sq ] 4
    if ($did(chartdialog,%sq) == Brown ) set %color $+ [ %sq ] 5
    if ($did(chartdialog,%sq) == Purple ) set %color $+ [ %sq ] 6
    if ($did(chartdialog,%sq) == Orange ) set %color $+ [ %sq ] 7
    if ($did(chartdialog,%sq) == LightYellow ) set %color $+ [ %sq ] 8
    if ($did(chartdialog,%sq) == LightGreen ) set %color $+ [ %sq ] 9
    if ($did(chartdialog,%sq) == Cyan ) set %color $+ [ %sq ] 10
    if ($did(chartdialog,%sq) == LightCyan ) set %color $+ [ %sq ] 11
    if ($did(chartdialog,%sq) == Blue ) set %color $+ [ $replace(%sq,14,26) ] 12
    if ($did(chartdialog,%sq) == PinkyPink ) set %color $+ [ $replace(%sq,14,26) ] 13
    if ($did(chartdialog,%sq) == Grey ) set %color $+ [ $replace(%sq,14,26) ] 14
    if ($did(chartdialog,%sq) == LightGrey ) set %color $+ [ $replace(%sq,14,26) ] 15
    if ($did(chartdialog,%sq) == $null ) set %color $+ [ $replace(%sq,14,26) ] 4
    if ($did(chartdialog,%sq) == royal rainbow ) set %color $+ [ $replace(%sq,14,26) ] RR
  }
}
on *:CLOSE:@chartgenerator: {
  dialog -x ChartDialog ChartDialog
  unset %x %px %py %grid %fine %legend %sq %xmouse %ymouse %zoomfactor %formula1 %formula2 %formula3 %color11 %color12 %color13 %s %bignumber %oldx %oldy %length %color26 %color27
}
menu channel {
  ChartGenerator: bb
}
alias -l bbb {
  .unset %px %py %oldx %oldy %x %y %poldx %poldy
  set %r 255
  set %g 15
  set %b 15
  if ( %color27 isnum ) drawdot @ChartGenerator %color27 2000 200 200
  else drawpic -s @chartgenerator 0 0 $window(@chartgenerator).w $window(@chartgenerator).h %color27
  set %s 0
  set %bignumber $iif(%zoomfactor == 0.8,3000, $iif(%zoomfactor == 4,700,$iif(%zoomfactor == 8 , 500 , $iif( %zoomfactor == 16, 300 , $iif( %zoomfactor == 32 , 100 , $iif( %zoomfactor == 64 , 50 , $iif(%zoomfactor == 128 , 30 , 30)))))))
  if ( %grid == 1 ) {
    drawline @ChartGenerator %color26 2 0 %ymouse 1600 %ymouse
    drawline @ChartGenerator %color26 2 %xmouse 0 %xmouse 900
    drawtext @chartgenerator %color26 tahoma 11 %xmouse %ymouse 0
    while %s < $calc(%bignumber /2) {
      if ( %zoomfactor == 0.8 ) inc %s 50
      if ( %zoomfactor == 4 ) inc %s 10
      if ( %zoomfactor == 8 ) inc %s 5
      if ( %zoomfactor == 16 ) inc %s
      if ( %zoomfactor == 32 ) || ( %zoomfactor == 64 ) || ( %zoomfactor == 128 ) inc %s 0.5
      if ( $calc(%xmouse - %s * %zoomfactor) > 0 ) drawline @ChartGenerator %color26 1 $calc(%xmouse - %s * %zoomfactor) 0 $calc(%xmouse - %s * %zoomfactor) 900
      if ( $calc(%ymouse - %s * %zoomfactor) > 0 ) drawline @ChartGenerator %color26 1 0 $calc(%ymouse - %s * %zoomfactor) 1200 $calc(%ymouse - %s * %zoomfactor)
      if ( $calc(%xmouse + %s * %zoomfactor) < $window(@ChartGenerator).w ) drawline @ChartGenerator %color26 1 $calc(%xmouse + %s * %zoomfactor) 0 $calc(%xmouse + %s * %zoomfactor) 900
      if ( $calc(%ymouse + %s * %zoomfactor) < $window(@ChartGenerator).h ) drawline @ChartGenerator %color26 1 0 $calc(%ymouse + %s * %zoomfactor) 1200 $calc(%ymouse + %s * %zoomfactor)
      drawtext @ChartGenerator %color26 tahoma 11 $calc(%xmouse - %s * %zoomfactor) %ymouse $calc(%s * -1)
      drawtext @ChartGenerator %color26 tahoma 11 $calc(%xmouse + %s * %zoomfactor) %ymouse %s
      drawtext @ChartGenerator %color26 tahoma 11 %xmouse $calc(%ymouse - %s * %zoomfactor) %s
      drawtext @ChartGenerator %color26 tahoma 11 %xmouse $calc(%ymouse + %s * %zoomfactor) $calc(%s * -1)
    }
  }
  if ( %formula1 != $null ) {
    set %x $calc(-1 * %bignumber)
    while %x < %bignumber {
      set %oldx %px
      set %oldy %py
      inc %x %fine
      set %px $calc( %x * %zoomfactor + %xmouse )
      set %py $calc( $calc( [ %formula1 ]  ) * %zoomfactor + %ymouse )
      if ( %py < %ymouse ) { set %py $calc( (%ymouse - %py ) + %ymouse ) | goto end }
      if ( %py > %ymouse ) { set %py $calc( %ymouse - ($calc( %py) - %ymouse ) ) | goto end }
      :end
      if ( %color11 == RR ) {
        if ( %r == 255 ) set %rfull 1
        if ( %g == 255 ) set %gfull 1
        if ( %b == 255 ) set %bfull 1
        if ( %r == 15 ) set %rfull 0
        if ( %g == 15 ) set %gfull 0
        if ( %b == 15 ) set %bfull 0
        if ( %rfull == 1 ) && (%gfull == 0 ) && (%bfull == 0) inc %g 8
        if ( %rfull == 1 ) && (%gfull == 1 ) && ( %bfull == 0) dec %r 8
        if ( %gfull == 1 ) && (%bfull == 0 ) && (%rfull == 0) inc %b 8
        if ( %gfull == 1 ) && (%bfull == 1) && ( %rfull == 0) dec %g 8
        if ( %bfull == 1 ) && (%rfull == 0 ) && (%gfull == 0) inc %r 8
        if ( %bfull == 1 ) && (%rfull == 1 ) && ( %gfull == 0) dec %b 8
        drawline -r @ChartGenerator $rgb(%r,%g,%b) 4 %px %py %oldx %oldy
      }
      else drawline @ChartGenerator %color11 4 %px %py %oldx %oldy
    }
  }
  if ( %formula2 != $null ) {
    .unset %px %py %oldx %oldy %x
    set %x $calc(-1 * %bignumber)
    while %x < %bignumber {
      set %oldx %px
      set %oldy %py
      inc %x %fine
      set %px $calc( %x * %zoomfactor + %xmouse )
      set %py $calc( $calc( [ %formula2 ]  ) * %zoomfactor + %ymouse )
      if ( %py < %ymouse ) { set %py $calc( (%ymouse - %py ) + %ymouse ) | goto end2 }
      if ( %py > %ymouse ) { set %py $calc( %ymouse - ($calc( %py) - %ymouse ) ) | goto end2 }
      :end2
      if ( %color12 == RR ) {
        if ( %r == 255 ) set %rfull 1
        if ( %g == 255 ) set %gfull 1
        if ( %b == 255 ) set %bfull 1
        if ( %r == 15 ) set %rfull 0
        if ( %g == 15 ) set %gfull 0
        if ( %b == 15 ) set %bfull 0
        if ( %rfull == 1 ) && (%gfull == 0 ) && (%bfull == 0) inc %g 8
        if ( %rfull == 1 ) && (%gfull == 1 ) && ( %bfull == 0) dec %r 8
        if ( %gfull == 1 ) && (%bfull == 0 ) && (%rfull == 0) inc %b 8
        if ( %gfull == 1 ) && (%bfull == 1) && ( %rfull == 0) dec %g 8
        if ( %bfull == 1 ) && (%rfull == 0 ) && (%gfull == 0) inc %r 8
        if ( %bfull == 1 ) && (%rfull == 1 ) && ( %gfull == 0) dec %b 8
        drawline -r @ChartGenerator $rgb(%r,%g,%b) 4 %px %py %oldx %oldy
      }
      else drawline @ChartGenerator %color12 4 %px %py %oldx %oldy
    }
  }
  if ( %formula3 != $null ) {
    .unset %px %py %oldx %oldy %x
    set %x $calc(-1 * %bignumber)
    while %x < %bignumber {
      set %oldx %px
      set %oldy %py
      inc %x %fine
      set %px $calc( %x * %zoomfactor + %xmouse )
      set %py $calc( $calc( [ %formula3 ]  ) * %zoomfactor + %ymouse )
      if ( %py < %ymouse ) { set %py $calc( (%ymouse - %py ) + %ymouse ) | goto end3 }
      if ( %py > %ymouse ) { set %py $calc( %ymouse - ($calc( %py) - %ymouse ) ) | goto end3 }
      :end3
      if ( %color13 == RR ) {
        if ( %r == 255 ) set %rfull 1
        if ( %g == 255 ) set %gfull 1
        if ( %b == 255 ) set %bfull 1
        if ( %r == 15 ) set %rfull 0
        if ( %g == 15 ) set %gfull 0
        if ( %b == 15 ) set %bfull 0
        if ( %rfull == 1 ) && (%gfull == 0 ) && (%bfull == 0) inc %g 8
        if ( %rfull == 1 ) && (%gfull == 1 ) && ( %bfull == 0) dec %r 8
        if ( %gfull == 1 ) && (%bfull == 0 ) && (%rfull == 0) inc %b 8
        if ( %gfull == 1 ) && (%bfull == 1) && ( %rfull == 0) dec %g 8
        if ( %bfull == 1 ) && (%rfull == 0 ) && (%gfull == 0) inc %r 8
        if ( %bfull == 1 ) && (%rfull == 1 ) && ( %gfull == 0) dec %b 8
        drawline -r @ChartGenerator $rgb(%r,%g,%b) 4 %px %py %oldx %oldy
      }
      else drawline @ChartGenerator %color13 4 %px %py %oldx %oldy
    }
  }
  if ( %legend == 1 ) {
    if ( %formula1 == $null ) && ( %formula2 == $null ) && ( %formula3 == $null ) halt
    if ( $len(%formula1) >= $len(%formula2)) && ( $len(%formula1) >= $len(%formula3)) set %length $len(%formula1)
    if ( $len(%formula2) >= $len(%formula1)) && ( $len(%formula2) >= $len(%formula3)) set %length $len(%formula2)
    if ( $len(%formula3) >= $len(%formula2)) && ( $len(%formula3) >= $len(%formula1)) set %length $len(%formula3)
    drawline @chartgenerator $iif(%color11 == RR, $rand(1,15), %color11) 100 80 750 $calc(%length * 6 + 120) 750
    drawline @chartgenerator 0 90 80 750 $calc(%length * 6 + 120) 750
    drawtext -p @chartgenerator 1 Tahoma 14 80 705 Legend:
    if ( %formula1 == $null ) && ( %formula2 != $null ) && ( %formula3 != $null ) { drawtext -p @chartgenerator 1 Tahoma 13 80 725  $+ [ $iif(%color12 == RR, $rand(1,15), %color12) ] $+ , $+ [ $iif(%color12 == RR, $rand(1,15), %color12) ] ×× == %formula2 | drawtext -p @chartgenerator 1 Tahoma 13 80 750  $+ [ $iif(%color13 == RR, $rand(1,15), %color13) ] $+ , $+ [ %color13 ] ×× == %formula3 }
    if ( %formula2 == $null ) && ( %formula1 != $null ) && ( %formula3 != $null ) { drawtext -p @chartgenerator 1 Tahoma 13 80 725  $+ [ $iif(%color11 == RR, $rand(1,15), %color11) ] $+ , $+ [ $iif(%color11 == RR, $rand(1,15), %color11) ] ×× == %formula1 | drawtext -p @chartgenerator 1 Tahoma 13 80 750  $+ [ $iif(%color13 == RR, $rand(1,15), %color13) ] $+ , $+ [ %color13 ] ×× == %formula3 }
    if ( %formula3 == $null ) && ( %formula2 != $null ) && ( %formula1 != $null ) { drawtext -p @chartgenerator 1 Tahoma 13 80 725  $+ [ $iif(%color11 == RR, $rand(1,15), %color11) ] $+ , $+ [ $iif(%color11 == RR, $rand(1,15), %color11) ] ×× == %formula1 | drawtext -p @chartgenerator 1 Tahoma 13 80 750  $+ [ $iif(%color12 == RR, $rand(1,15), %color12) ] $+ , $+ [ $iif(%color12 == RR, $rand(1,15), %color12) ] ×× == %formula2 }
    if ( %formula1 == $null ) && ( %formula2 == $null ) && ( %formula3 != $null ) { drawtext -p @chartgenerator 1 Tahoma 13 80 750  $+ [ $iif(%color13 == RR, $rand(1,15), %color13) ] $+ , $+ [ $iif(%color13 == RR, $rand(1,15), %color13) ] ×× == %formula3 }
    if ( %formula3 == $null ) && ( %formula1 == $null ) && ( %formula2 != $null ) { drawtext -p @chartgenerator 1 Tahoma 13 80 750  $+ [ $iif(%color12 == RR, $rand(1,15), %color12) ] $+ , $+ [ $iif(%color12 == RR, $rand(1,15), %color12) ] ×× == %formula2 }
    if ( %formula3 == $null ) && ( %formula2 == $null ) && ( %formula1 != $null ) { drawtext -p @chartgenerator 1 Tahoma 13 80 750  $+ [ $iif(%color11 == RR, $rand(1,15), %color11) ] $+ , $+ [ $iif(%color11 == RR, $rand(1,15), %color11) ] ×× == %formula1 }
    if ( %formula3 != $null ) && ( %formula2 != $null ) && ( %formula1 != $null ) {
      drawtext -p @chartgenerator 1 Tahoma 13 80 725  $+ [ $iif(%color11 == RR, $rand(1,15), %color11) ] $+ , $+ [ $iif(%color11 == RR, $rand(1,15), %color11) ] ×× == %formula1
      drawtext -p @chartgenerator 1 Tahoma 13 80 750  $+ [ $iif(%color12 == RR, $rand(1,15), %color12) ] $+ , $+ [ $iif(%color12 == RR, $rand(1,15), %color12) ] ×× == %formula2
      drawtext -p @chartgenerator 1 Tahoma 13 80 775  $+ [ $iif(%color13 == RR, $rand(1,15), %color13) ] $+ , $+ [ $iif(%color13 == RR, $rand(1,15), %color13) ] ×× == %formula3
    }
  }
}
dialog ChartDialog {
  title "ChartGenerator"
  size -1 -1 141 125
  option dbu
  box "Colors", 14, 80 12 56 49
  box "Additional options", 16, 2 60 85 64
  box "Formulas", 10, 1 12 77 45
  button "Generate!", 1, 92 76 48 12
  combo 2, 5 77 50 11, drop
  edit "%x ^1", 3, 4 23 69 11, autohs autovs
  text "Zoom factor", 4, 56 78 30 9
  edit "%x ^2", 5, 4 34 69 10, autohs autovs
  edit "%x ^3", 6, 4 44 69 10, autohs autovs
  text "Made by CAsercan3", 7, 90 103 48 7
  button "Help", 8, 92 63 48 12
  check "Grid", 9, 5 68 26 8
  combo 11, 84 21 50 11, drop
  combo 12, 84 33 50 11, drop
  combo 13, 84 44 50 11, drop
  text "PLEASE insert mIRC formulas, like $sqrt(%x) or %x ^2 ", 17, 3 2 137 8
  check "Legend", 18, 33 68 31 8
  combo 26, 5 89 50 12, drop
  combo 27, 5 100 50 11, drop
  text "grid color", 28, 56 90 22 8
  text "background", 29, 56 101 29 8
  edit "", 30, 5 111 32 10
  text "increase x by this", 31, 38 112 45 7
  button "Exit", 15, 92 88 48 12
  menu "File", 19
  item "Open...", 20, 19
  item "Save chart image...", 22, 19
  item "Save chart data...", 23, 19
  item "center chart", 24, 19
  item "About", 25, 19
  item "Exit", 21, 19
}
on *:dialog:chartdialog:menu:20: {
  set %file $sfile(C:\*.ini,Open Chart INI file...,Open)
  $iif($readini(%file,ChartData,color11) isnum, did -c chartdialog 11 $calc($readini(%file,ChartData,color11) +1) , did -c chartdialog 11 $replace($readini(%file,ChartData,color11),RR,17))
  $iif($readini(%file,ChartData,color12) isnum, did -c chartdialog 12 $calc($readini(%file,ChartData,color12) +1) , did -c chartdialog 12 $replace($readini(%file,ChartData,color12),RR,17))
  $iif($readini(%file,ChartData,color13) isnum, did -c chartdialog 13 $calc($readini(%file,ChartData,color13) +1) , did -c chartdialog 13 $replace($readini(%file,ChartData,color13),RR,17))
  $iif($readini(%file,ChartData,color26) isnum, did -c chartdialog 26 $calc($readini(%file,ChartData,color26) +1) , did -c chartdialog 26 $replace($readini(%file,ChartData,color26),RR,17))
  $iif($readini(%file,ChartData,color27) isnum, did -c chartdialog 27 $calc($readini(%file,ChartData,color27) +1), did -c chartdialog 27 18)
  $iif($readini(%file,ChartData,color27) isnum, noop , set %color27 $readini(%file,ChartData,color27))
  did -ra chartdialog 3 $readini(%file,n,ChartData,form1)
  did -ra chartdialog 5 $readini(%file,n,ChartData,form2)
  did -ra chartdialog 6 $readini(%file,n,ChartData,form3)
  set %xmouse $readini(%file,ChartData,xmouse)
  set %ymouse $readini(%file,ChartData,ymouse)
  did -c chartdialog 2 $iif($readini(%file,ChartData,zoomfactor) == .8,1,$iif($readini(%file,ChartData,zoomfactor) == 4,2,$iif($readini(%file,ChartData,zoomfactor) == 8,3,$iif($readini(%file,ChartData,zoomfactor) == 16,4,$iif($readini(%file,ChartData,zoomfactor) == 32,5,$iif($readini(%file,ChartData,zoomfactor) == 64,6,$iif($readini(%file,ChartData,zoomfactor) == 128,7,3)))))))
  did $iif($readini(%file,ChartData,grid) == 1,-c,-u) chartdialog 9
  did $iif($readini(%file,ChartData,legend) == 1,-c,-u) chartdialog 18
  did -ra chartdialog 30 $readini(%file,ChartData,fine)
  chart_eval
  bbb
}
on *:dialog:chartdialog:menu:21: {
  dialog -x ChartDialog ChartDialog
  window -c @ChartGenerator
  unset %x %px %py %grid %fine %legend %sq %xmouse %ymouse %zoomfactor %formula1 %formula2 %formula3 %color11 %color12 %color13 %s %bignumber %oldx %oldy %length %color26 %color27 %file %r %g %b %rfull %gfull %bfull
}
on *:dialog:chartdialog:menu:22: {
  drawsave @chartgenerator $sfile(C:\*.jpg,Save Chart Image,Save) $+ .bmp
}
on *:dialog:chartdialog:menu:23: {
  set %file $sfile(C:\*.ini,Save Chart Data...,Save)
  chart_eval
  writeini %file ChartData form1 $did(chartdialog,3)
  writeini %file ChartData form2 $did(chartdialog,5)
  writeini %file ChartData form3 $did(chartdialog,6)
  writeini %file ChartData Zoomfactor $calc($did(chartdialog,2) * 8)
  writeini %file ChartData color11 %color11
  writeini %file ChartData color12 %color12
  writeini %file ChartData color13 %color13
  writeini %file ChartData fine %fine
  writeini %file ChartData color26 %color26
  writeini %file ChartData color27 %color27
  writeini %file ChartData xmouse %xmouse
  writeini %file ChartData ymouse %ymouse
  writeini %file ChartData legend %legend
  writeini %file ChartData grid %grid
}
on *:dialog:chartdialog:menu:24: {
  set %xmouse $calc($window(@chartgenerator).w /2)
  set %ymouse $calc($window(@chartgenerator).h /2)
  chart_eval
  bbb
}
on *:DIALOG:ChartDialog:init:0: {
  did -a chartdialog 2 .1
  did -a chartdialog 2 .5
  did -a chartdialog 2 1
  did -a chartdialog 2 2
  did -a chartdialog 2 4
  did -a chartdialog 2 8
  did -a chartdialog 2 16
  did -c chartdialog 9
  did -c chartdialog 2 3
  set %grid 1
  set %fine 1
  did -ra chartdialog 30 1
  set %sq 10
  while %sq != 27 {
    inc %sq
    if ( %sq == 14 ) set %sq 26
    did -a chartdialog %sq White
    did -a chartdialog %sq Black
    did -a chartdialog %sq DarkBlue
    did -a chartdialog %sq Green
    did -a chartdialog %sq FireRed
    did -a chartdialog %sq Brown
    did -a chartdialog %sq Purple
    did -a chartdialog %sq Orange
    did -a chartdialog %sq LightYellow
    did -a chartdialog %sq LightGreen
    did -a chartdialog %sq Cyan
    did -a chartdialog %sq LightCyan
    did -a chartdialog %sq Blue
    did -a chartdialog %sq PinkyPink
    did -a chartdialog %sq Grey
    did -a chartdialog %sq LightGrey
    did -c chartdialog %sq $rand(1,15)
  }
  did -a chartdialog 11 Royal Rainbow
  did -a chartdialog 12 Royal Rainbow
  did -a chartdialog 13 Royal Rainbow
  did -c chartdialog 26 2
  did -c chartdialog 27 1
  did -a chartdialog 27 Browse...
}
on *:DIALOG:ChartDialog:sclick:27: {
  if ( $did(chartdialog,27) == Browse... ) set %color27 $shortfn($sfile(C:\*.JPG,Select a background picture,Open))
}
on *:DIALOG:ChartDialog:sclick:1: {
  chart_eval
  bbb
}
on *:DIALOG:ChartDialog:sclick:8: {
  dialog -mda ChartHelp ChartHelp
}
on *:DIALOG:charthelp:sclick:1: {
  dialog -x charthelp charthelp
}
on *:DIALOG:ChartDialog:sclick:15: {
  window -c @ChartGenerator
  dialog -x ChartDialog ChartDialog
  unset %x %px %py %grid %fine %legend %sq %xmouse %ymouse %zoomfactor %formula1 %formula2 %formula3 %color11 %color12 %color13 %s %bignumber %oldx %oldy %length %color26 %color27 %file %r %g %b %rfull %gfull %bfull
}
on *:DIALOG:chartdialog:close:0: {
  window -c @ChartGenerator
  unset %x %px %py %grid %fine %legend %sq %xmouse %ymouse %zoomfactor %formula1 %formula2 %formula3 %color11 %color12 %color13 %s %bignumber %oldx %oldy %length %color26 %color27 %file %r %g %b %rfull %gfull %bfull
}
dialog charthelp {
  title "Help with ChartGenerator"
  size -1 -1 123 98
  option dbu
  edit "Thanks for downloading my newest script, ChartGenerator. This will help you if you don't know how to use it. The increase-x-by-this editbox lets you choose how precise the chart should be drawn, the smaller this number, the slower it goes. The zoom factor is how big the distance between every x and y is. You can specify a color in the combo box next to the formula. If you don't want ChartGenerator to calculate a formula, leave it blank. This chartgenerator can only calculate formulas in which you use identifiers, operators and variables such as %x $sin(...) $cos(...) $tan(...) $acos(...) $atan(...) $asin(...) $sqrt(...) $log(...) + - * / ^ (...) % . Made by CAsercan3 www.CA-clan.com. ", 2, 1 2 120 82, read multi vsbar
  button "Exit", 1, 44 84 32 12
}
;EOF